The range
You are not required to report on it, but in the context of gender pay gap reporting, the range is your organisation’s pay dispersion, or the difference between the lowest hourly rate of pay and the highest. If the range is large, the mean or the median is not as representative of the data as it would be if the range was small, and so the greater your pay dispersion, the less reliable your calculations of the gender pay gap are.
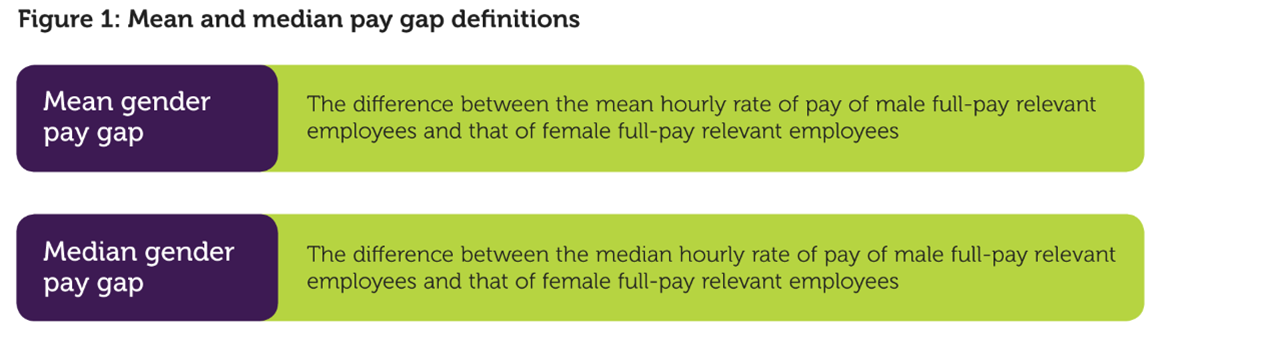
The mean
The mean gives you an overall indication of the size of your gender pay gap and of your gender bonus gap. It also tells you something about how you manage pay in your organisation, especially when looked at in the context of the range.
A high mean gender pay gap, coupled with a high mean gender bonus gap and a large range, is often symptomatic of a payment system that tends to disadvantage women, so if this is what you are faced with, consider drilling down further into your payment system, for example, by checking for differences in starting salaries for men and women (both on recruitment, and on promotion), either by carrying out spot checks, or by implementing a full equal pay audit.
If your mean gender bonus gap is high, you may want to introduce gender monitoring of your performance appraisal system and examine the impact of managerial discretion on the award of bonuses.
The median
The median gives you an indication of what the ‘typical’ situation is, but, if your organisation has a complex pay system, there may not be a typical situation. By failing to take account, for example, of the impact on the gender pay gap of a small group of very highly paid employees, as the median isn’t affected by extreme figures, a median can give you a ‘false positive’, meaning that you don’t take the action necessary to close the gap.
If there is no typical situation in your organisation, gender monitoring of differences in pay outcomes is an essential safeguard against the risks of a gender pay gap that is out of control and of equal pay claims being raised. This means checking who is paid what by gender, noting the differences by gender and exploring the possible reasons for these. It may be, for example, that the reason for the gender gap (especially in industries previously regarded as typically male) is that the women, being relatively new, are younger and less experienced. On the other hand, these younger women may have better educational qualifications than their older male colleagues.
The mean and the median read together
The reason that the legislation requires both mean and median figures is to provide these different perspectives, so you typically need to consider both measures. When the mean and the median have the same or roughly the same value – for example, when the mean pay gap is 13%, and the median pay gap is 14% – the dataset is not skewed, and you can be reasonably certain that your employees, male and female, are being paid within the same income range, whatever that might be.
On the other hand, if the mean gender pay gap and the median gender pay gap are widely different, the dataset is skewed, either by the presence of very low earners (where the mean is below the median), and/or by a group of very high earners (where the mean is above the median). And if most employees in either of those groups of earners are mainly men or mainly women, a gender pay gap issue arises. In the context of gender pay gap reporting, we don’t only want to know what most people earn – the median – but also how the outliers affect the overall distribution of pay between men and women – the mean.
If the mean and the median are widely different, you may want to consider a range of initiatives, including checking the uptake of your flexible working arrangements, and taking action to break down occupational segregation.
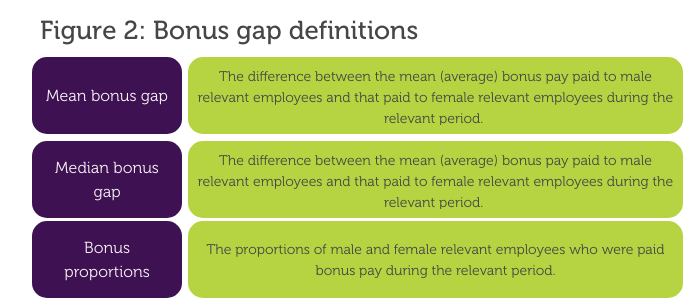
Proportions
Comparing the proportions of men and women who receive a bonus within the 12-month period tells you how much more likely male full-pay relevant employees are to receive any amount of bonus payment compared with female full-pay relevant employees (and vice versa). If no bonuses have been paid to the relevant employees, the percentage figure will be zero.
In some organisations, the differences in cash value of a bonus awarded to a woman and a man may be explained by the distribution of part-time work. If you consider that your gender bonus gap has been skewed because a percentage bonus has been paid to full-time and part-time employees, you may want to explain this skewing in your narrative.
The comparative basis of a proportion is central to its usefulness as an indicator. The Regulations require you to report specifically on the proportions of men and women getting a bonus, and the proportions of men and women in each quartile pay band. In future years, you will also be able to track your progress by comparing your figures with those from previous years. This means you will be able to say, for example, that whereas in 2017, 25% of women received a bonus payment, by 2019 this had risen to 30%.
The Regulations ask you to report on the proportions of men and women receiving bonuses, and on the proportions of men and women in each quartile pay band, and to express these proportions as a percentage.
Quartiles
The quartile distribution is intended to give you information about the ‘glass pyramid’, or how the relevant full-pay male and female employees are distributed across your organisation. If men and women are not evenly distributed throughout the organisation, you may wish to check your recruitment and progression procedures and your flexible working arrangements (see below).
The calculation of the quartiles will also pick up on pay gaps at the top of the organisation, even if the mean and median figures have masked this.
Example: What quartile pay bands can tell you
Marten Materials manufactures industrial flooring. It has two sites, one in the northwest of England and another in the Scottish Borders. On the snapshot date it has 783 employees. The company is highly gender-segregated, with men designing, producing and delivering the products, and women performing the administrative work, servicing online sales and doing the cleaning and catering. Marten is aware of this segregation but has not thought it relevant to pay.
Its quartile pay band distribution across the two sites is as follows:
| Quartile |
Women (%) |
Men (%) |
| Upper |
2 |
98 |
| Upper middle |
20 |
80 |
| Lower middle |
50 |
50 |
| Lower |
90 |
10 |
Managers at the Scottish site express surprise at this distribution, and further analysis reveals that at the Borders site, gender segregation is much less pronounced, with a woman on the management team, and several women working in the production roles, which make up the upper-middle quartile pay band. The Borders site also has male cleaners. Scottish managers think that the differences may be down to the way in which the company recruits, in that the Borders site uses online recruitment and, when advertising through the local Jobcentre, does not assign the jobs to the ‘engineering’ section. Recruitment to the English site is largely by word of mouth. Marten decides to open up its recruitment procedures and monitor the impact of this on the quartile pay band distribution.