
Data
Recruitment and redundancy outlook
Stay up to date with the latest recruitment and redundancy trends in the UK.
Understanding how your organisation compares can enable you to stay ahead, retain valuable employees, and understand the cost of attrition to your organisation
Staff turnover, or the proportion of the workforce that leaves an employer each year is highly sought-after data that enables organisations to benchmark. This compilation and analysis of the key statistics will help you understand staff turnover and tenure rates in the UK. We’ve used figures from the Annual Population Survey (APS), the largest UK household survey, undertaken by the Office for National Statistics (ONS).
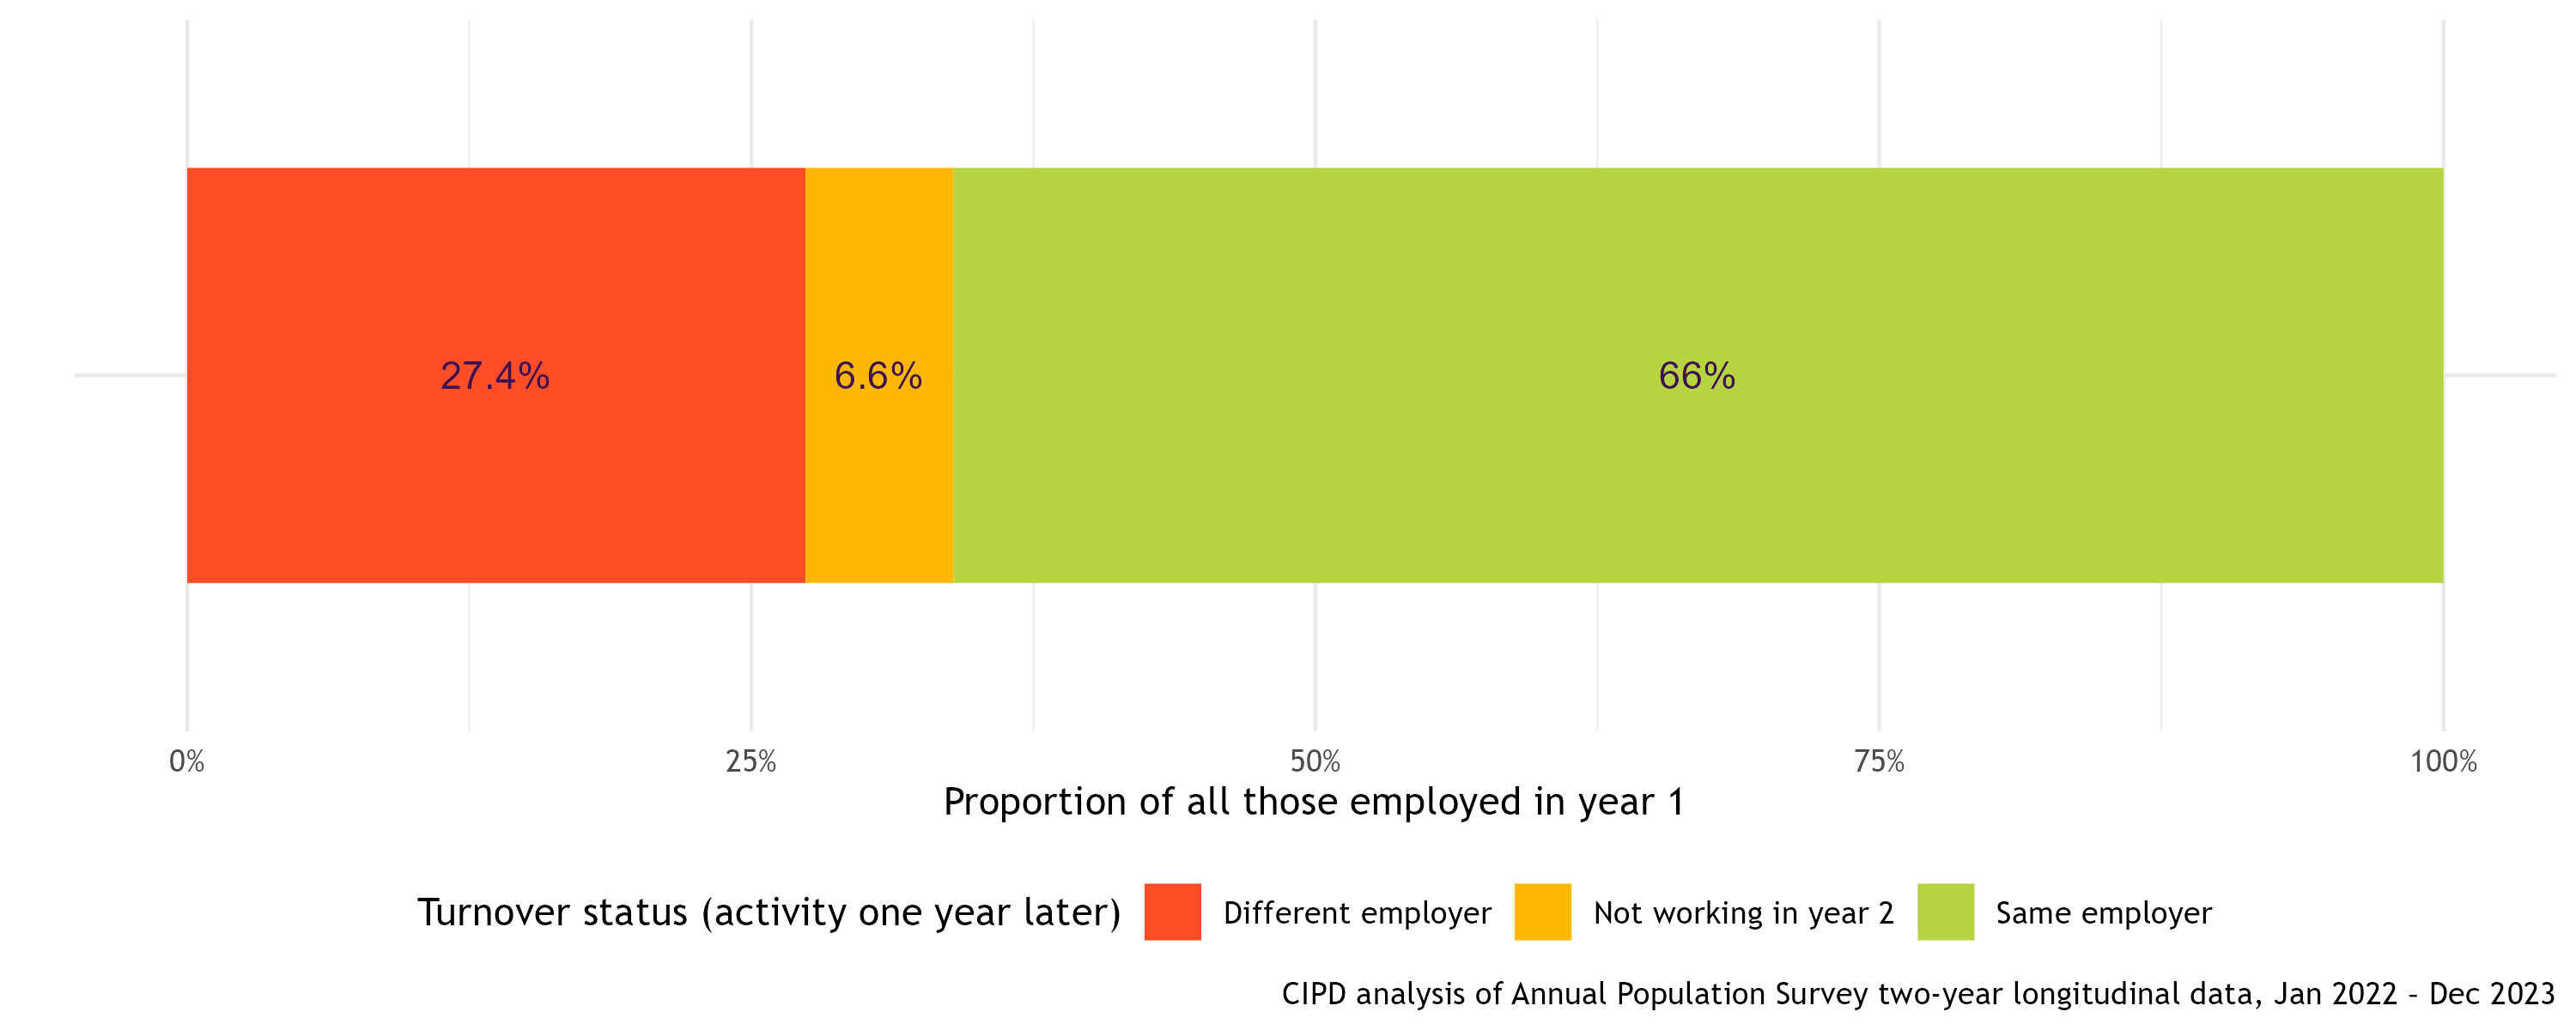
The average turnover - or churn - for UK workers is 34%. This splits into 27.4% who move to a new employer and 6.6% who are not working one year later (year 2), which could be due to study, retirement or long-term sickness, for example. Most employees (two-thirds) remain in the same organisation from one year to the next.
Average UK turnover rate (Jan 2022–Dec 2023)
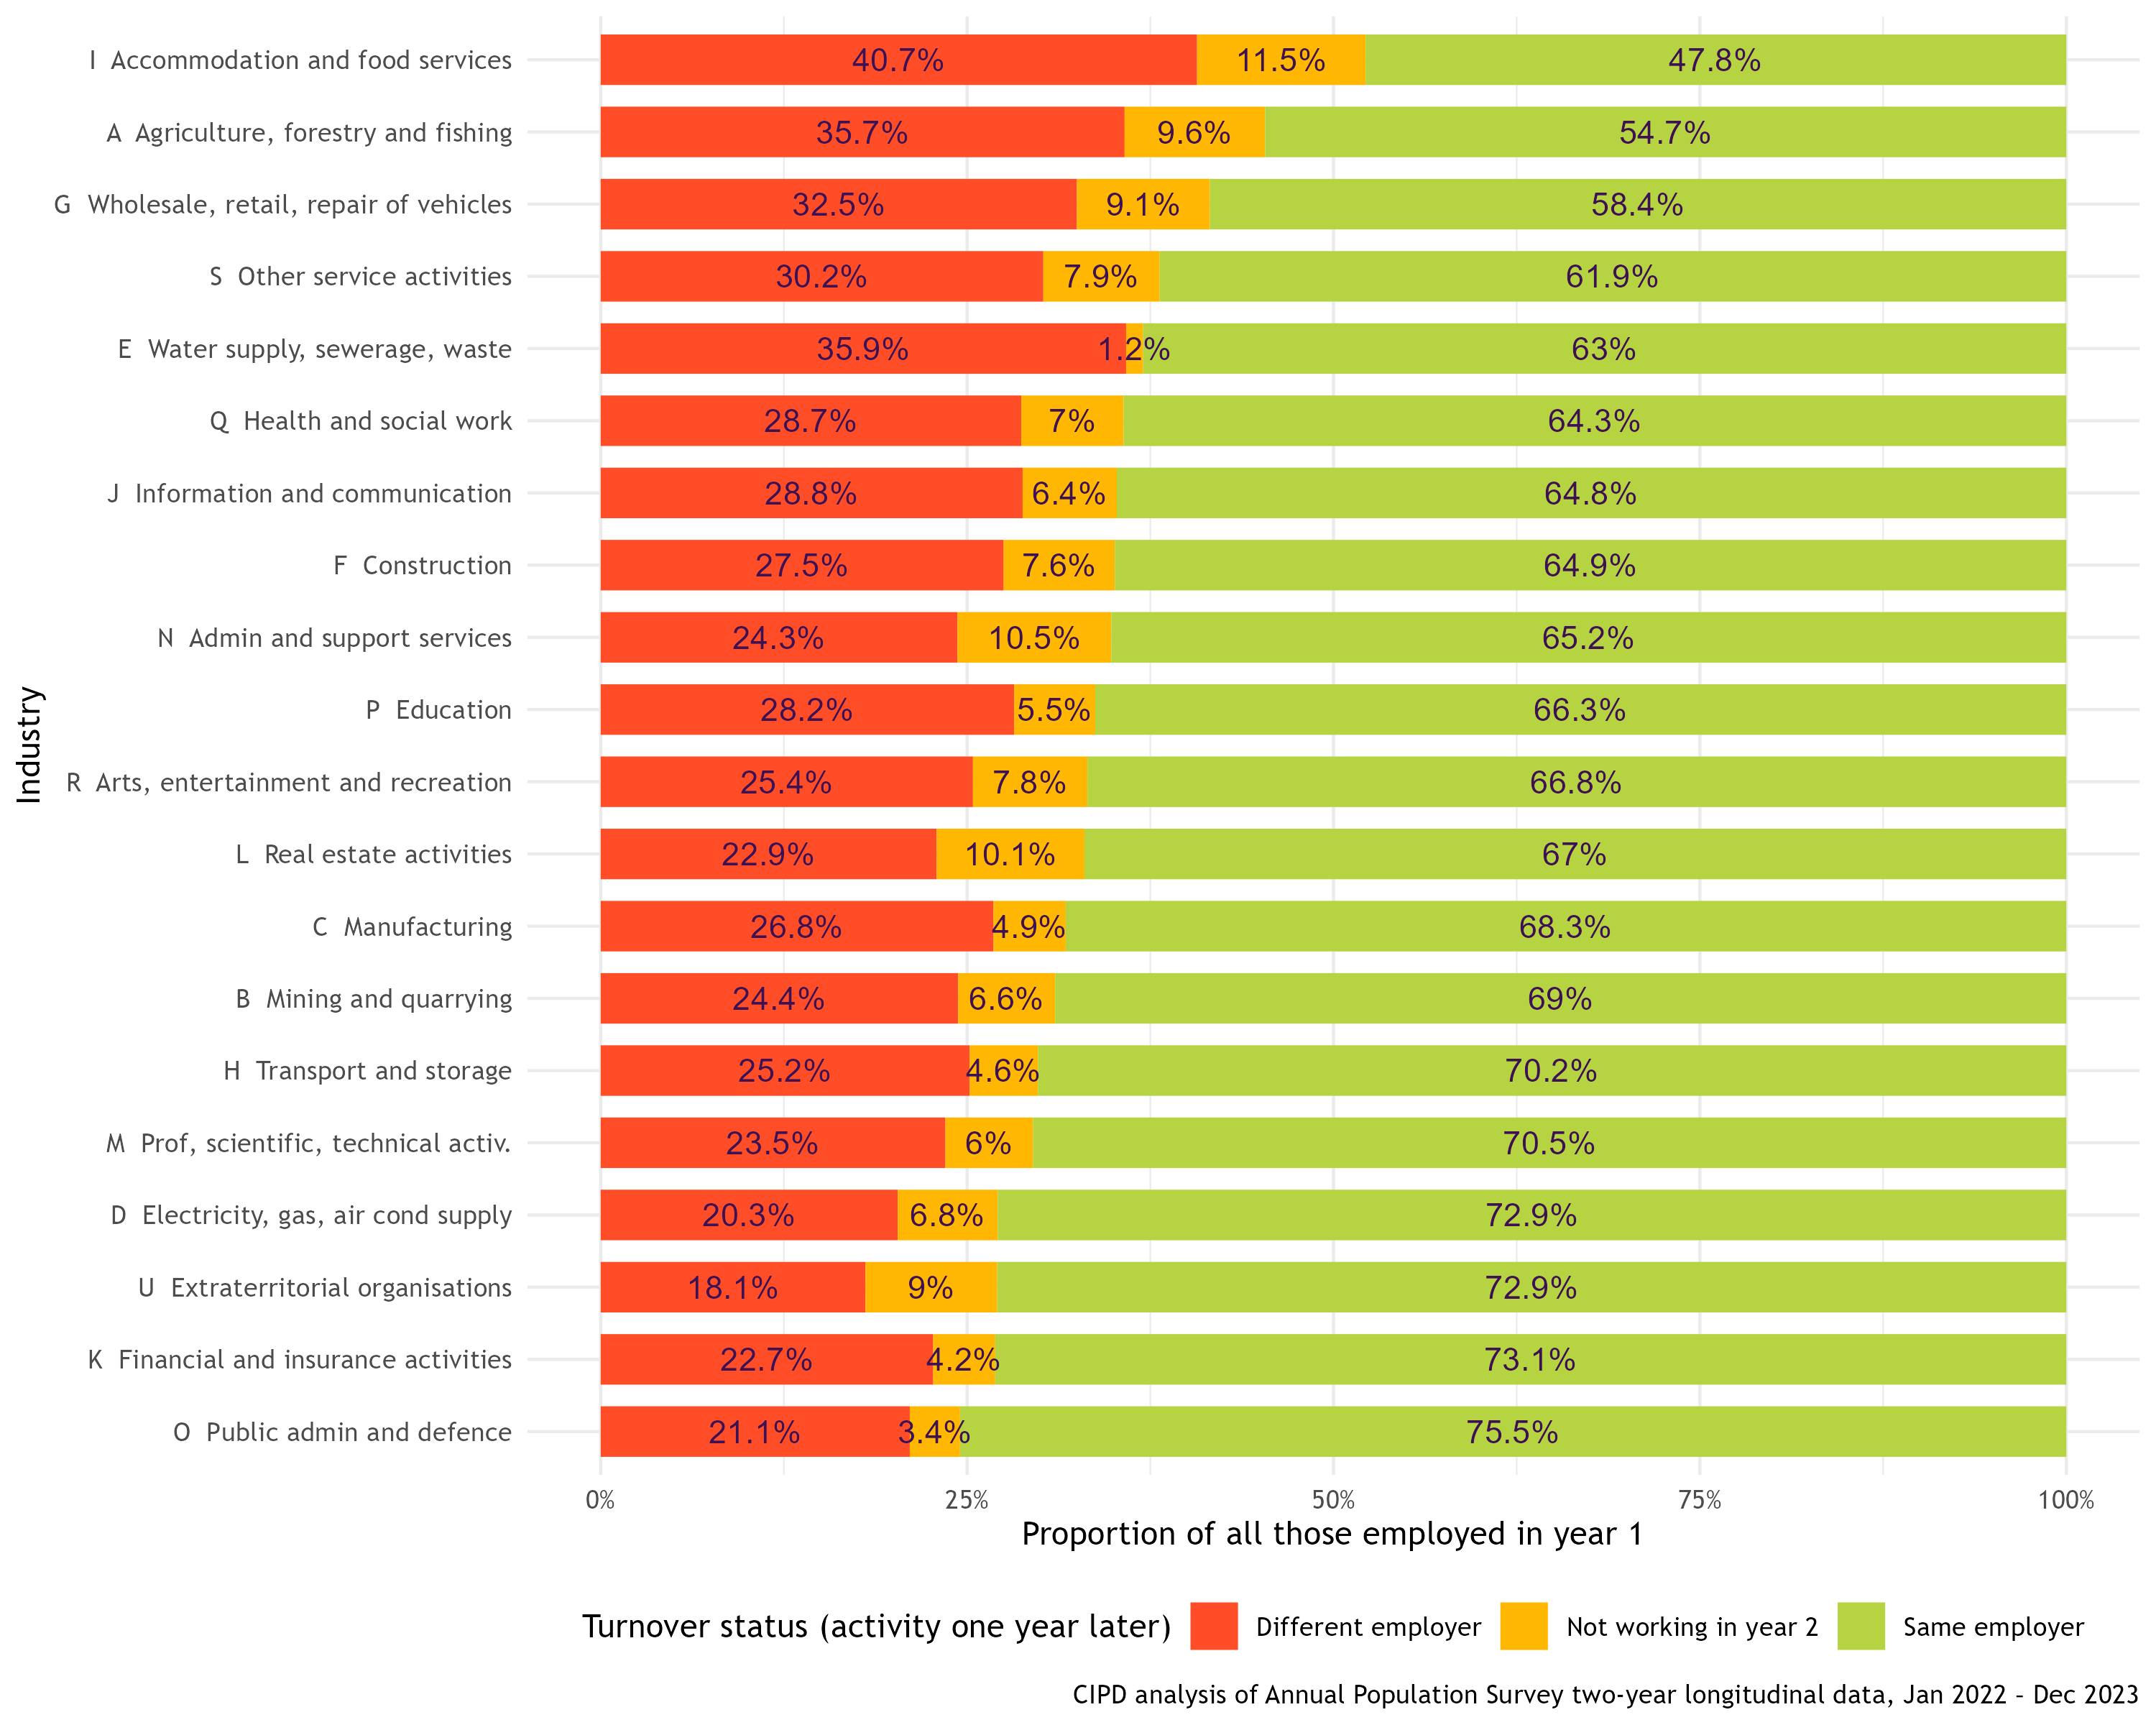
The most popular request from CIPD members is for industry figures, to enable them to compare themselves to other similar organisations. This is shown in the chart below for 2022–23. Staff attrition rates (a synonym for turnover rates) vary from 25% in the public administration and defence sector to 52% in hospitality.
UK turnover by industry (Jan 2022–Dec 2023)
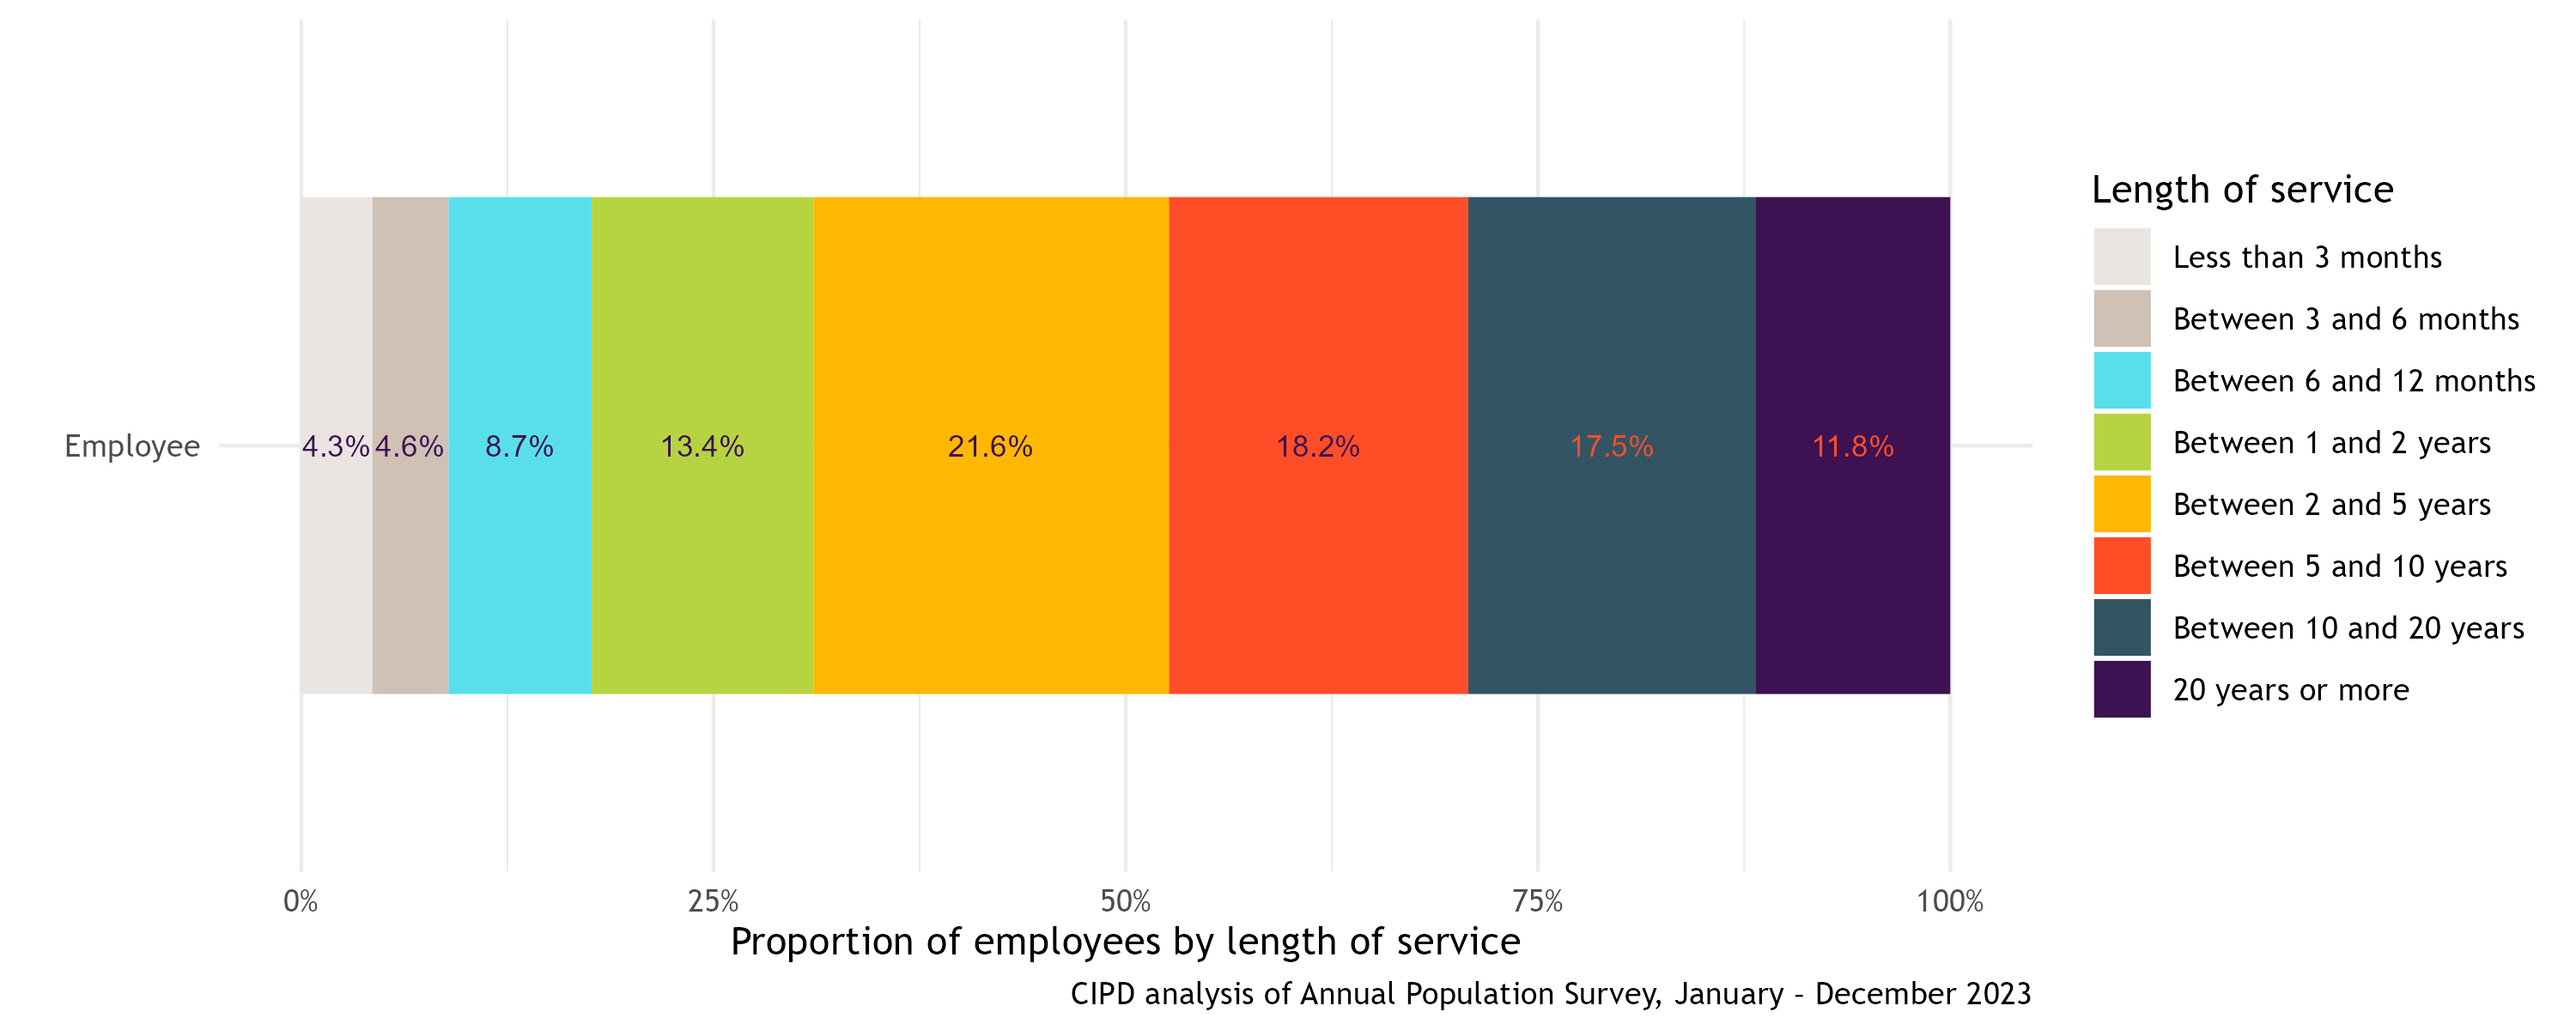
A similar benchmarking tool to turnover is tenure. This is how long someone has worked for an organisation. Turnover helps you understand the rate at which people leave while tenure helps you understand your wider workforce. The national tenure figures for 2023 are shown in the chart below.
Tenure of UK employees (Jan–Dec 2023)
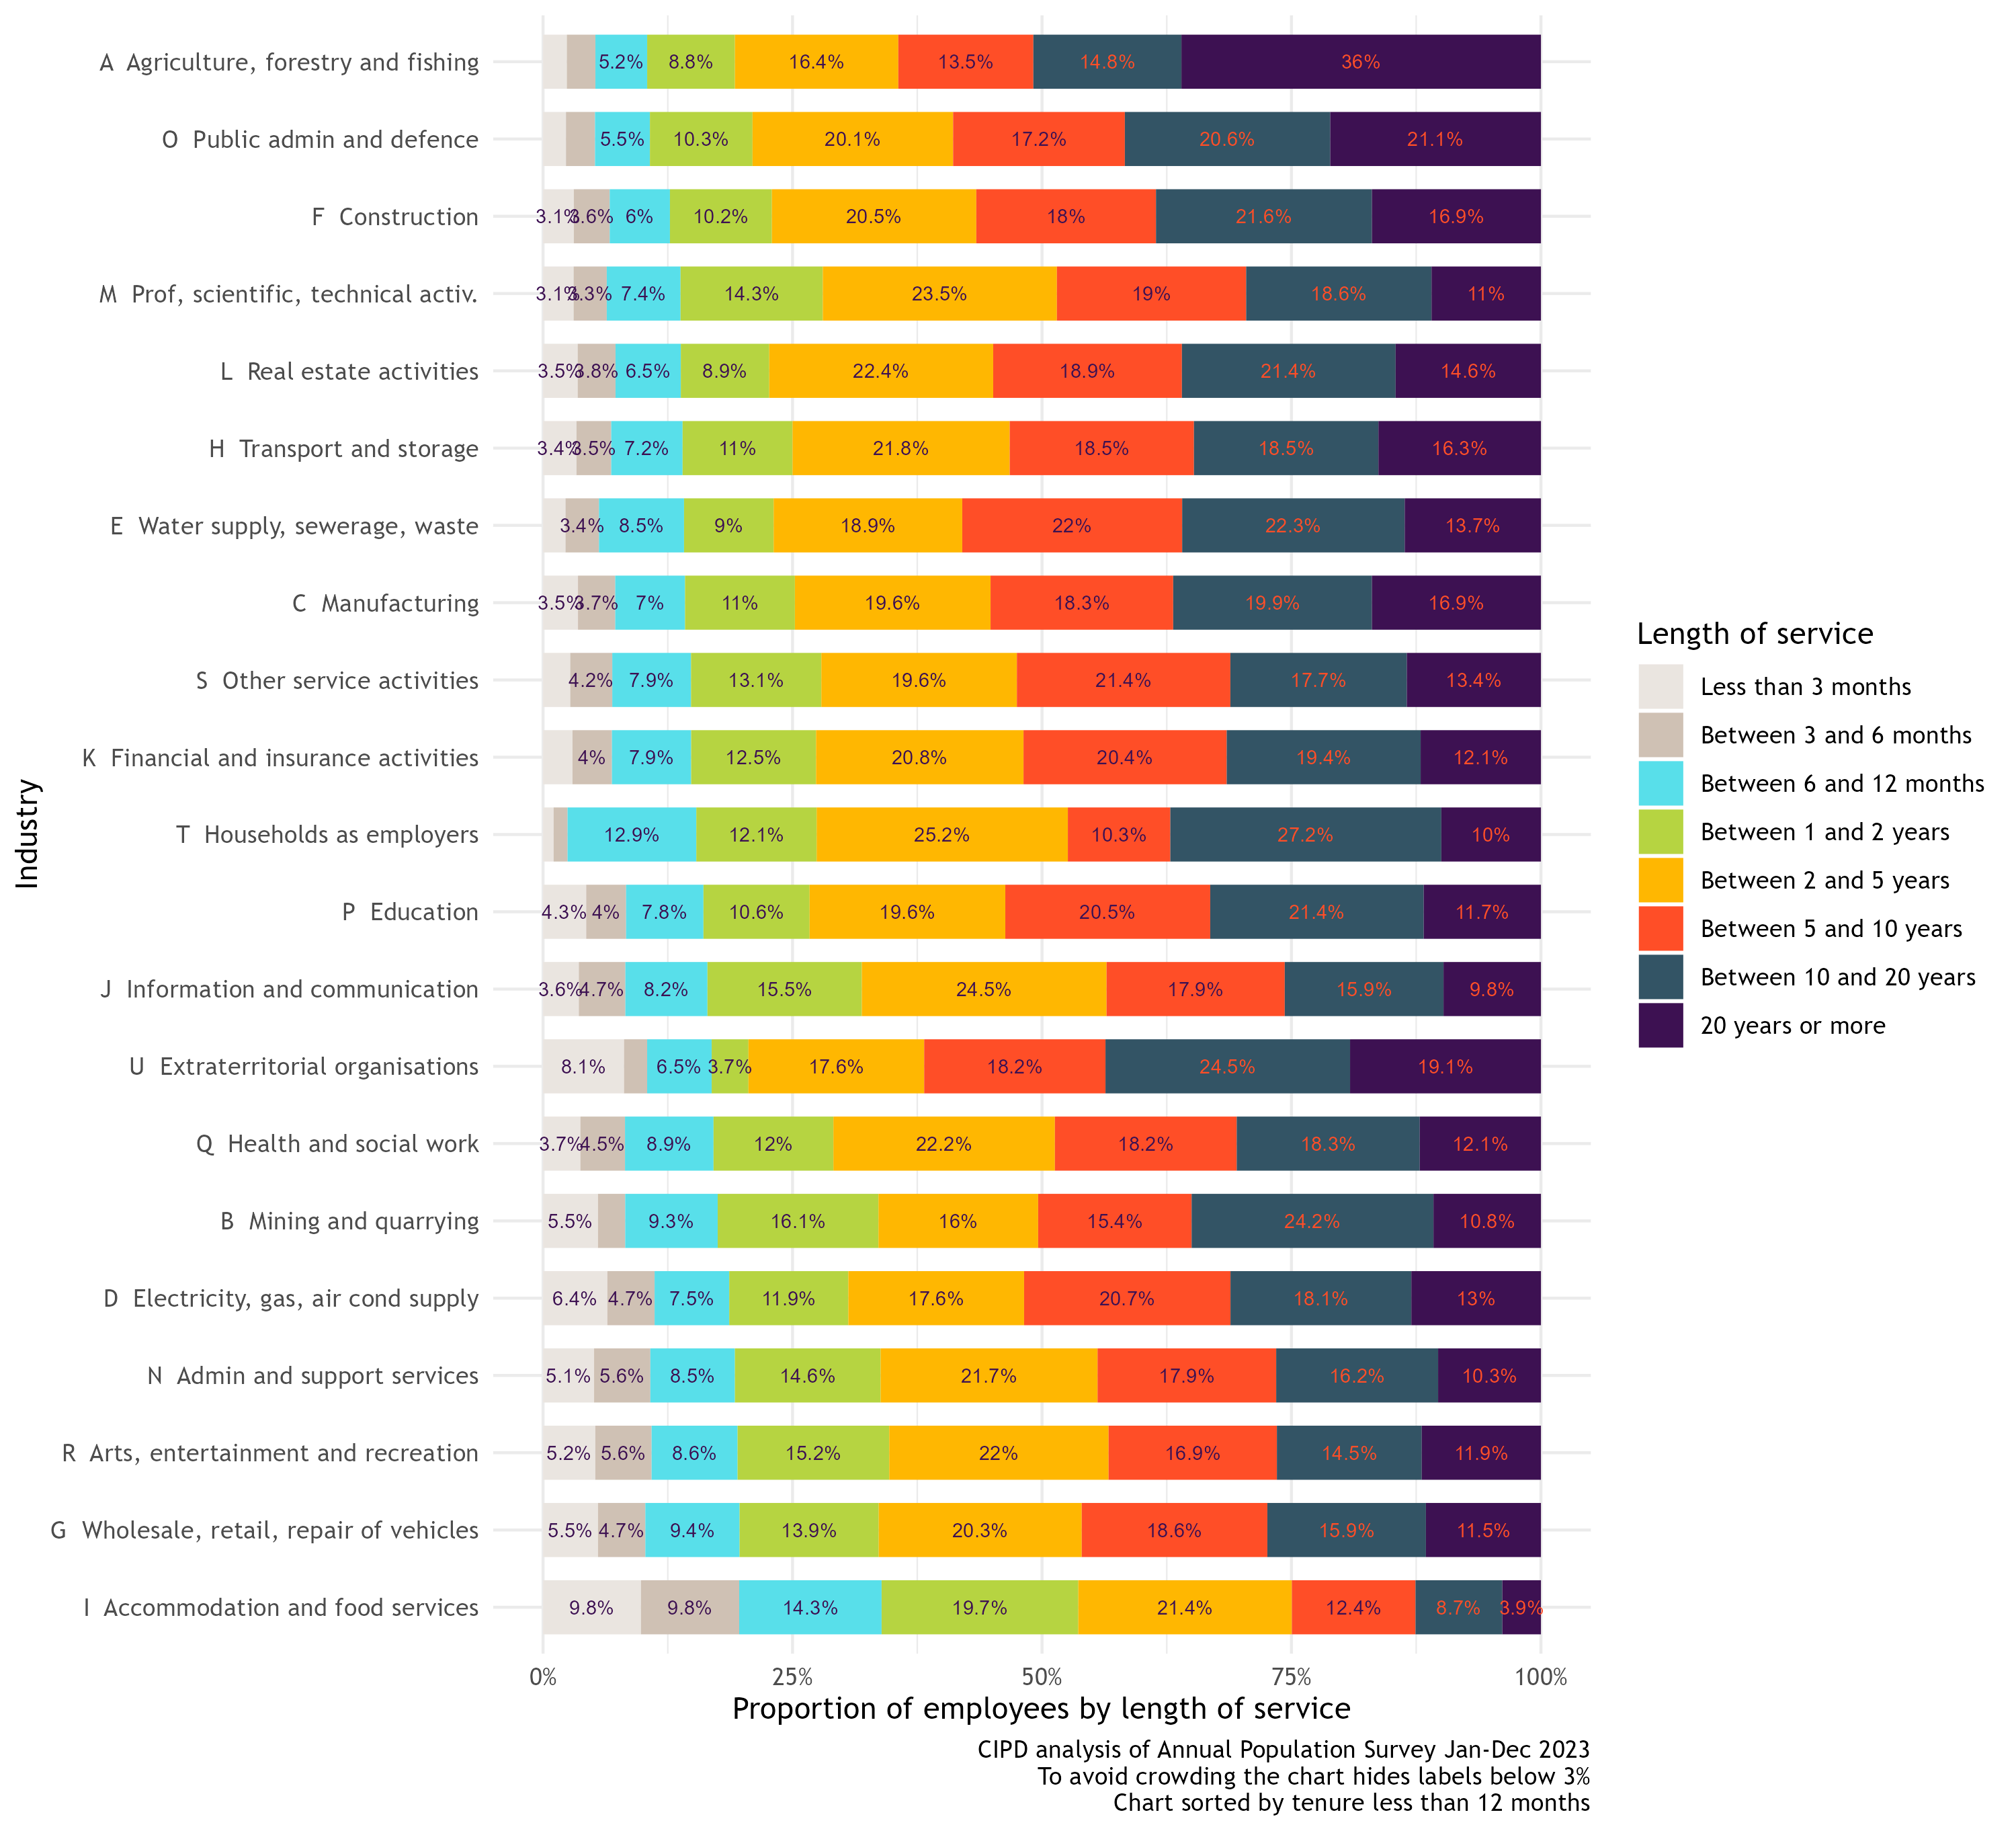
Tenure can also be broken down by industry and, as with turnover, not all industries are the same. While there have been small changes in both employee turnover and tenure over the last couple of years, because unemployment has remained low in this period, these changes have been minute. As reported in the Labour Market Outlook – Spring 2024, the proportion of employees with a tenure of less than 12 months has reverted to the pre-pandemic level of around 16%. It had risen to a high of 18% in early 2022.
UK tenure by industry (Jan–Dec 2023)
But what constitutes a healthy level of churn? High turnover means you lose talent, and when certain skills are scarce, recruitment can be costly. However, if turnover is low, you risk not bringing new ideas into the organisation.
As shown in the charts above, churn differs markedly by industry. Hospitality (‘Accommodation and food services’) for example, has the highest rate of churn and the lowest tenure. It has many low-paid and lower-skilled roles, and the youngest age profile of any industry by a substantial margin. The costs in terms of training someone new, and the loss of firm-specific capital are much lower, and thus a higher churn rate is less damaging for a business.
However, especially where skills are relatively scarce, recruitment is costly or employers have hard-to-fill vacancies, turnover is likely to be problematic. Employees who hold more in-demand or specialist skills, or who have developed strong relationships with customers, will be more valuable to employers and therefore more damaging for a business to lose, particularly if they move to a direct competitor.
People leave organisations for many reasons. There may be ‘pull’ factors such as the attraction of a new job, or ‘push’ factors, such as organisational change or a perceived lack of career development opportunities. But by monitoring turnover and understanding how it affects business performance, we can identify trends and issues to ensure employees experience good work.
Yet, the CIPD’s Resourcing and Talent Planning Report 2022 found that only 17% of respondents calculated the cost of labour turnover and just 12% collected data to evaluate and improve retention initiatives.
The best data here is your own. The major costs to track include:
Many costs consist of indirect management or administrative time, but direct costs can also be substantial where advertisements, agencies or assessment centres are used in recruitment.
For more guidance on measuring turnover and retention, as well as current labour market trends, refer to the following CIPD resources:
The APS is a large household survey undertaken by the ONS. The survey covers a diverse range of topics, including personal characteristics, labour market status, work characteristics, education and health. It includes a longitudinal dataset which enables us to see what people were doing at one point in time, and what they were doing one year later.
The CIPD has run this analysis on five separate occasions and the results have looked similar each year.
The industry categorisation uses a system known as Standard Industrial Classification (SIC).
Capture your everyday learning—record your CPD and turn insight into real impact.
A once-in-a-generation shift in employment law is coming. Be ready before it comes into force.
Entries are now open - a chance to recognise outstanding people practice and celebrate those shaping better work and working lives.

Stay up to date with the latest recruitment and redundancy trends in the UK.


Read our latest Labour Market Outlook report for analysis on employers’ recruitment, redundancy and pay intentions

Discover how the CIPD and the Institute for the Future of Work (IFOW) found insights from eight diverse case studies around the friction between AI and workforce stability. Learn why strategic pauses are necessary and why safeguarding your organisation’s future expertise is essential

Discover how the CIPD and the Institute for the Future of Work are supporting organisations in understanding how to take a people-centred approach to integrate AI-enabled solutions effectively and responsibly at work

Find out what people professionals said about their working lives and career development prospects in our recent pulse survey

As artificial intelligence continues its rapid advancement and becomes the much touted focus for investment and development, we highlight the critical role of the people profession and explain how the CIPD and its members will be involved shaping its impact at work